Class 8 Data Handling
Ex 5.1 Data Handling
1. For which of these would you use a histogram to show the data?
(a) The number of letters for different areas in a postman’s bag.
(b) The height of competitors in an athletics meet.
(c) The number of cassettes produced by 5 companies.
(d) The number of passengers boarding trains from 7:00 a.m. to 7:00 p.m. at a station. Give reasons for each.
The following list gives the shoppers who came during thefirst hour in the morning:W W W G B W W M G G M M W W W W G B M W B G G M W W M M W WW M W B W G M W W W W G W M M W W M W G W M G W M M B G G W
Make a frequency distribution table using tally marks.
Draw a bar graph to illustrate it.
(i) Which group has the maximum number of workers?
(ii) How many workers earn ` 850 and more?
(iii) How many workers earn less than ` 850?
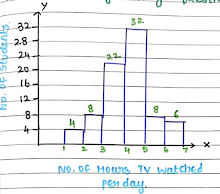
Answer the following.
(i) For how many hours did the maximum number of students watch TV?
(ii) How many students watched TV for less than 4 hours?
(iii) How many students spent more than 5 hours in watching TV?
Ex 5.1 Data Handling complete free PDF
Ex 5.2 Data Handling
From this pie chart answer the following:
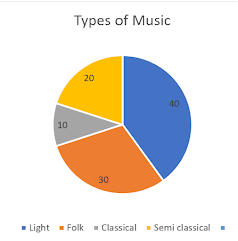
(i) If 20 people liked classical music, how many young people were surveyed?
(ii) Which type of music is liked by the maximum number of people?
(iii) If a cassette company were to make 1000 CD’s, how many of each type would they make?
| Seasons | Number of Votes |
| Summer | 90 |
| Rainy | 120 |
| Winter | 150 |
(i) Which season got the most votes?
(ii) Find the central angle of each sector.
(iii) Draw a pie chart to show this information.
| Colours | Number of People |
| Blue | 18 |
| Green | 9 |
| Red | 6 |
| Yellow | 3 |
| Total | 36 |
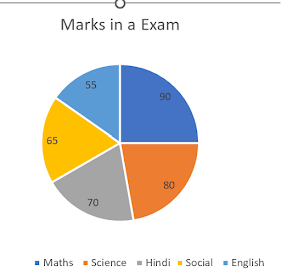
(i) In which subject did the student score 105 marks?
(Hint: for 540 marks, the central angle = 360°. So, for 105 marks, what is the central angle?)
(ii) How many more marks were obtained by the student in Mathematics than in Hindi?
| Language | Hindi | English | Marathi | Tamil | Bengali | Total |
| Number of students | 40 | 12 | 9 | 7 | 4 | 72 |
Ex 5.3 Data Handling
1. List the outcomes you can see in these experiments.
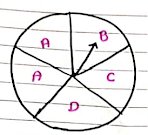
(a) Spinning a wheel
(b) Tossing two coins together
2. When a die is thrown, list the outcomes of an event of getting
(i) (a) a prime number
(b) not a prime number.
(ii) (a) a number greater than 5
(b) a number not greater than 5.
3. Find the.
(a) Probability of the pointer stopping on D in (Question 1-(a))?
(b) Probability of getting an ace from a well shuffled deck of 52 playing cards?
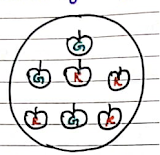
(c) Probability of getting a red apple. (See figure below)
What is the probability of .
(i) getting a number 6?
(ii) getting a number less than 6?
(iii) getting a number greater than 6?
(iv) getting a 1-digit number?
6. Find the probabilities of the events given in Question 2
Useful Links: